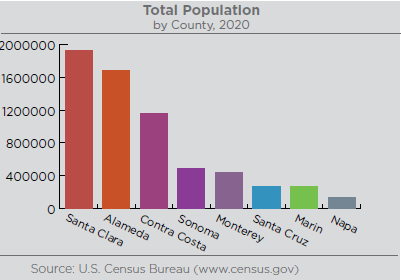
In 2020, Sonoma County was estimated to have 488,863 residents. This is more than Monterey, Santa Cruz, Marin, and Napa counties who have populations less than 440,000. Sonoma County's population is also significantly less than Contra Costa, Alameda, and Santa Clara counties who have populations over 1 million.
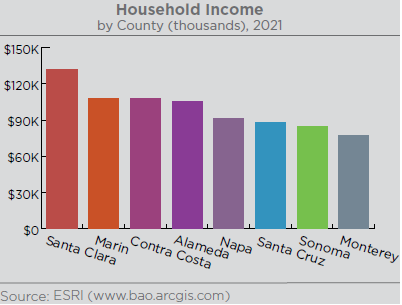
As of 2021, Sonoma County’s median household income was $84,978. The only Bay Area county that had a lower median household income was Monterey ($77,453). The other Bay Area counties are ranked as follows; Napa ($91,451), Santa Cruz ($88,030), Contra Costa ($108,209), Alameda ($105,545), Marin ($108,240), and Santa Clara ($131,856).
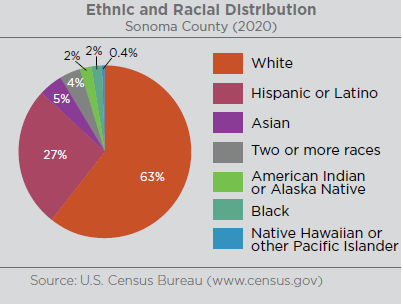
The 2021 population of Sonoma County is predominantly white (61.9%). Individuals of Latino or Hispanic origin represent the largest minority group, accounting for over a quarter of the population (27.3%). Other ethnic and racial groups represent a smaller portion of the population: Asian (4.6%), Two or More Races (4%), American Indian or Alaska Native (2.2%), Black (2.1%), and Native Hawaiian or other Pacific Islander (0.4%). Over time, the White population appears to be decreasing, while the Hispanic and/or Latino population is growing.
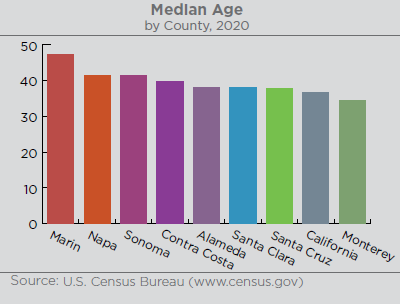
Sonoma County has the second highest median age compared to neighboring counties at 41.4 years. It falls behind only Marin County (47.2 years) and is equivalent to Napa’s median age. This aging population in the county could be partially responsible for the robust growth that the healthcare industry has experienced in Sonoma County. The largest age cohort in the county is persons 40-59 years old (26.2%), followed by persons 30-49 years old (25.1%).
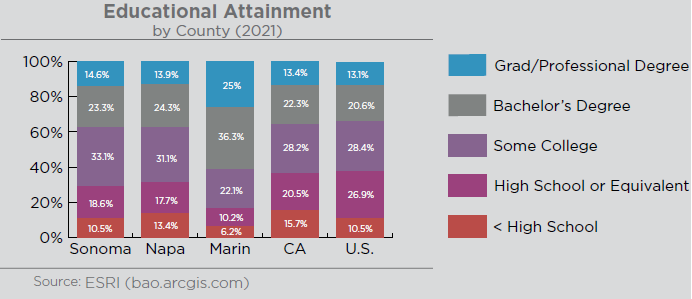
Sonoma County out performs the California average in rates of attending Some College, attaining a Bachelor’s Degree, and attaining a Graduate/Professional degree. It still trails Marin County in Bachelor’s and Grad/Professional Degree attainment. In terms of attaining at least a high school diploma, Sonoma County aligns with the U.S. average (89.5%).