Cost of Living

If you’ve been priced out a San Francisco or Marin, and are tired of long commutes and gridlock, Sonoma County offers a great community with a high quality of life, and is also among the most affordable in the Bay Area. Check out the numbers or come visit and see for yourself.

Sonoma CountyMarin CountySan Francisco CountyContra Costa CountyNapa CountySources
Housing
Median Sales Price – Jul 2021$761,000 $1,750,000 $1,852,500 $940,000$939,000car.org
YtoY Change – Median Home Sales Price (Jul 2021)6.5%13.2%11.3%19.7%20%car.org
Median 1-Br Rental – Aug 2021$1,602 $2,305 $2,399 $1,680apartmentlist.com
Median 2-Br Rental – Aug 2021$2,145 $2,850 $2,776 $2,062apartmentlist.com
YtoY % Change – Median Rental Price (Aug 2021)10.2%5.3%0.25%5.7%apartmentlist.com
Household
Number of Households – 2019190,689105,298365,851399,79248,107census.gov
Commute
Average Commute Time (Minutes) – 201926.133.534.739.326.9census.gov
Wages
Mean Hourly Wage – Q1 2021$30.43$36.01$44.53 $36.70$30.41labormarketinfo.edd.ca.gov
Mean Annual Wage – Q1 2021$63,289$74,906$92,619 $76,328$64,248labormarketinfo.edd.ca.gov

2022 Sonoma County Indicators

Below are highlights from the 2022 Sonoma County Indicators Report, an annual measure of Sonoma County’s overall health using six metrics— economic, environment, health, society, tourism and workforce. The report also benchmarks Sonoma County’s performance to similar counties in California, including Alameda, Contra Costa, Marin, Monterey, Napa, Santa Clara, and Santa Cruz. Read full report at the Sonoma County Economic Development Board’ website

This graph is illustrating the median home prices for the same 7 bay are counties. Santa Clara has the highest cost for homes being $1.3 million and Contra Costa having the lowest cost for homes at almost $700,000.

Median House Price

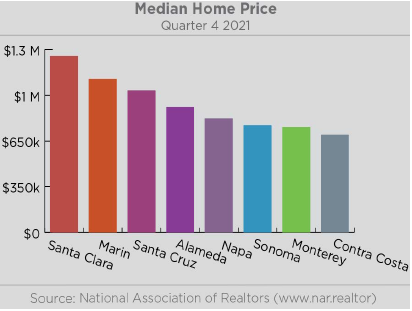
The median sale price of existing single-family homes recorded in Q4 2020 across Bay Area counties shows Sonoma County to have a relatively low median sale price of $678,000. This is exceptionally low compared to Santa Clara County, with a median home price of $1.1 million and Marin County, with a median home sale price of $980,000. Contra Costa ($626,000) and Monterey ($633,000) counties were the only two with lower median home prices.

Median Rent

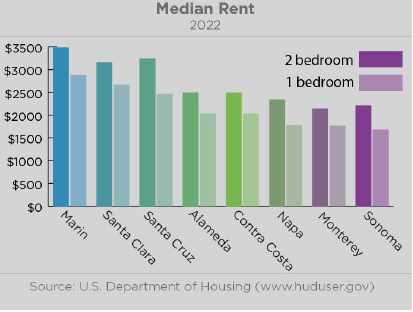
As median rent continues to rise, Sonoma County fares well relative to its Bay Area neighbors. With a median 1-bedroom rent of $2,215 Sonoma County has the lowest median rent of the Bay Area counties. Considering its proximity to the Bay Area, it is likely that rent will continue to increase in Sonoma County in the years to come.

This graph is illustrating how many uninsured residents there are within Sonoma County and California.

Health Insurance

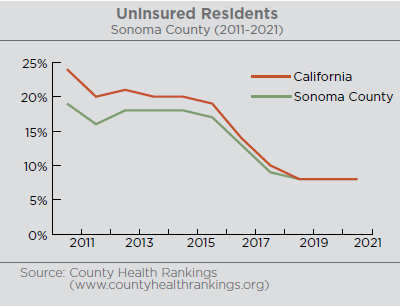
Sonoma County’s adult population has become increasingly more insured since 2011. With better access to insurance, the healthcare and support industry has benefitted from more local demand. This decrease in percent of residents who are uninsured in Sonoma County is likely due to the wider access to health care offered by the Affordable Care Act.

This graph is illustrating educational attainment by county.

Educational Attainment

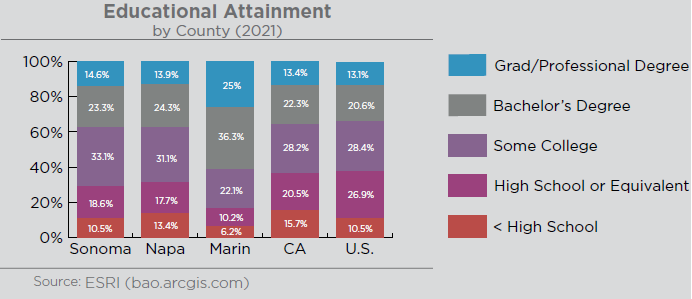
Sonoma County out performs the California average in rates of attending Some College, attaining a Bachelor’s Degree, and attaining a Graduate/Professional degree. It still trails Marin County in Bachelor’s and Grad/Professional Degree attainment. In terms of attaining at least a high school diploma, Sonoma County aligns with the U.S. average (89.5%).

This graph is illustrating the air quality, aka % of days with good air, in Sonoma County in 2021. Sonoma County had 88% of days with air considered “good quality”.

Air Quality

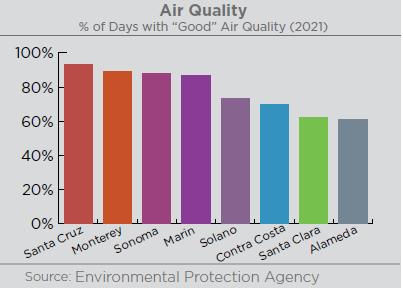
Air quality relates to the quality of life through the risk on human health brought on by pollution. In 2019, Sonoma County ranked highest for air quality among comparable counties in the Bay Area. The quality of air was classified as “good” on 348 days (88%) of the year. Sonoma County never experienced a day classified as unhealthy, even for sensitive groups. (2019)

This graph is illustrating the crime rate by county with Sonoma having the lowest crime rate and alameda county having the highest.

Crime Rate

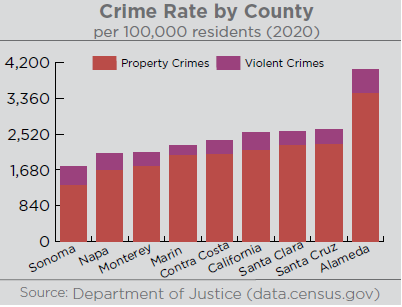
The 2020 crime rate data reveals Sonoma County has among the lowest crime rates in the Bay Area. This is particularly true regarding property crime rates, where Sonoma County has the lowest rate (1,312 per 100,000 residents). When factoring in both property and violent crimes, Sonoma County ranks lowest among other Bay Area counties. Crime rates are related to public safety, an important indicator for societal health.